⚙️ 5 Metrics That Prove a Control Works. "It Exists" Didn't Make the List.
Existence checks are the weakest claim you can make about a control. Five GRC Engineering effectiveness checks: what each replaces, how to measure it, and what it lets you decide.
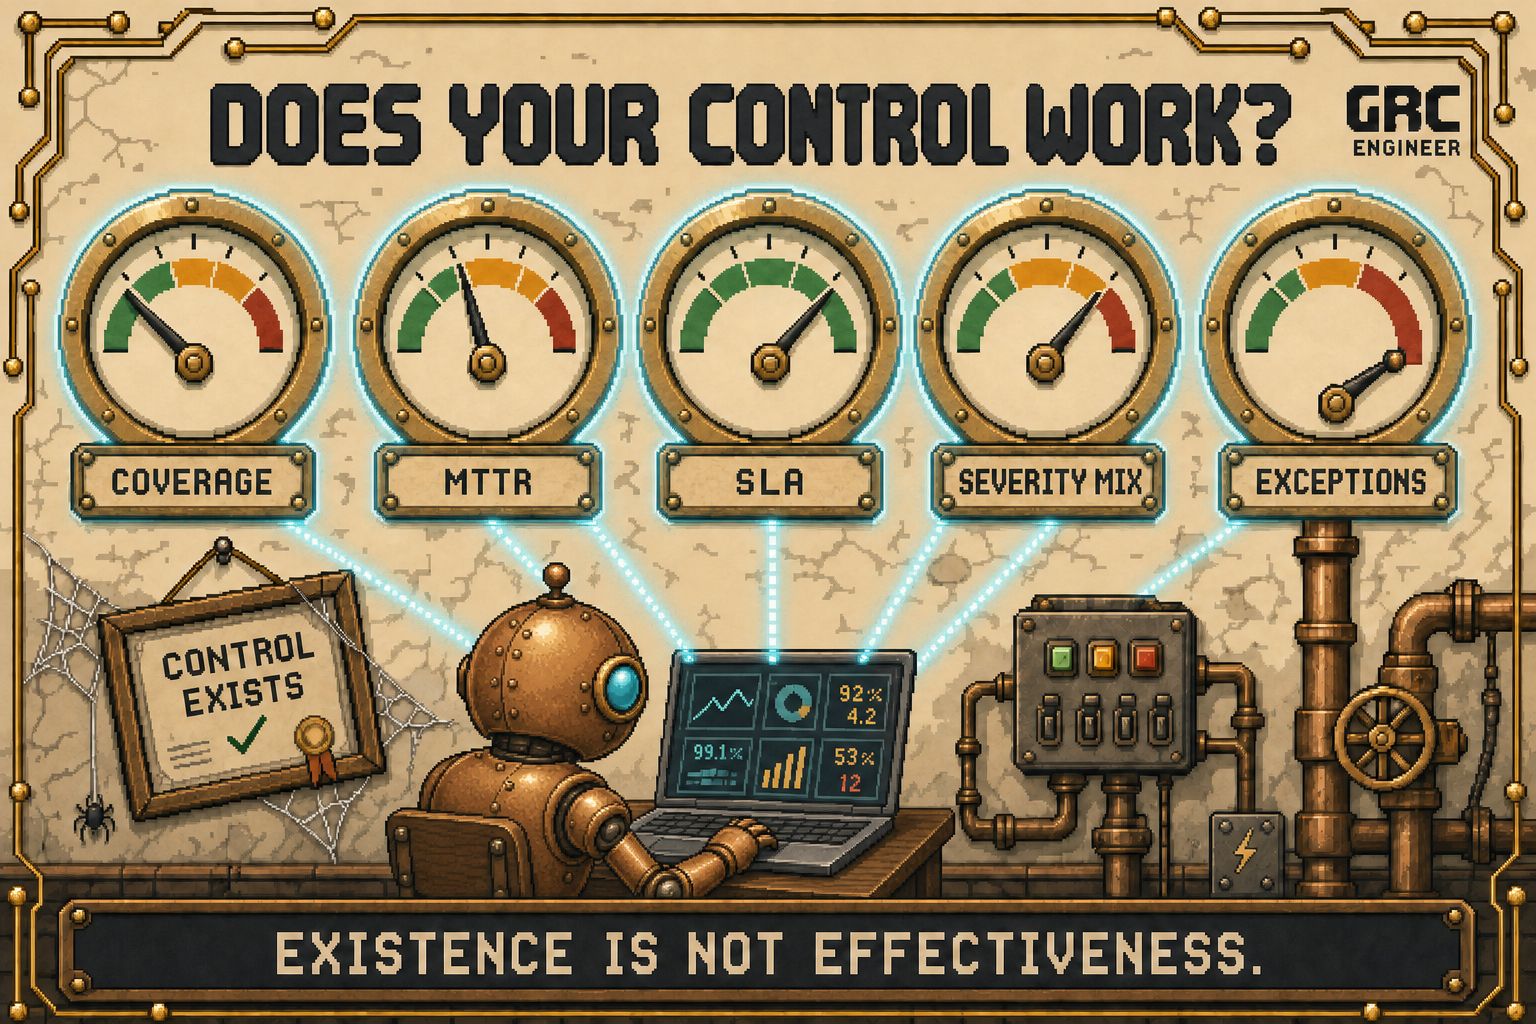
The strongest claim your audit makes is "it's there"
Walk through your last audit and look at what was actually proven. The control exists. A policy describes it, a screenshot shows it configured, an auditor sampled a sliver of the population and found no exceptions.
Existence is the weakest possible claim about a control. A vuln scanner that exists can be scanning 40% of your assets. An offboarding control that exists can be running nine days late. An MFA policy that exists can be waived for half of engineering through exceptions nobody counts.
A control is a process with a failure rate, not a fact, and processes are measured, not attested.
I made this argument last September, in a post comparing GRC to pre-SRE operations theatre: SREs measure what users actually experience, while GRC measures whether documentation exists. Last week the argument got a much bigger voice. Phil Venables, ex-CISO of Goldman Sachs and Google Cloud, published Control Reliability Engineering: control failure is a reliability problem, deserving the machinery SRE built for uptime. SLIs and SLOs for controls, error budgets with consequences, and a scoping warning worth framing: 100% completion might mean nothing if success was framed as covering only 20% of the environment.
One of the most credentialed CISO voices writing today just told the industry to instrument its controls. What follows is the instrument panel: five metrics, and for each one, what it replaces, how to measure it, what improvement looks like, and what it lets you decide.
IN PARTNERSHIP WITH MYSELF

CTRL+F: your daily dose of GRC Engineering
CTRL+F is the daily game for GRC professionals, and it is the "get technical" curriculum wearing a puzzle costume. Seven tracks, one per weekday: read machine-readable evidence on Monday, run the numbers on Tuesday, test the intent, spot the assurance, ship it, translate, pick your battles. Two minutes, one keyboard, no login.
It pairs uncomfortably well with this issue. The five metrics below are the instrument panel; the game is your daily reps at reading the instruments. Play today's track at grcengineer.com/ctrl-f and reply with your streak once you have one worth defending.
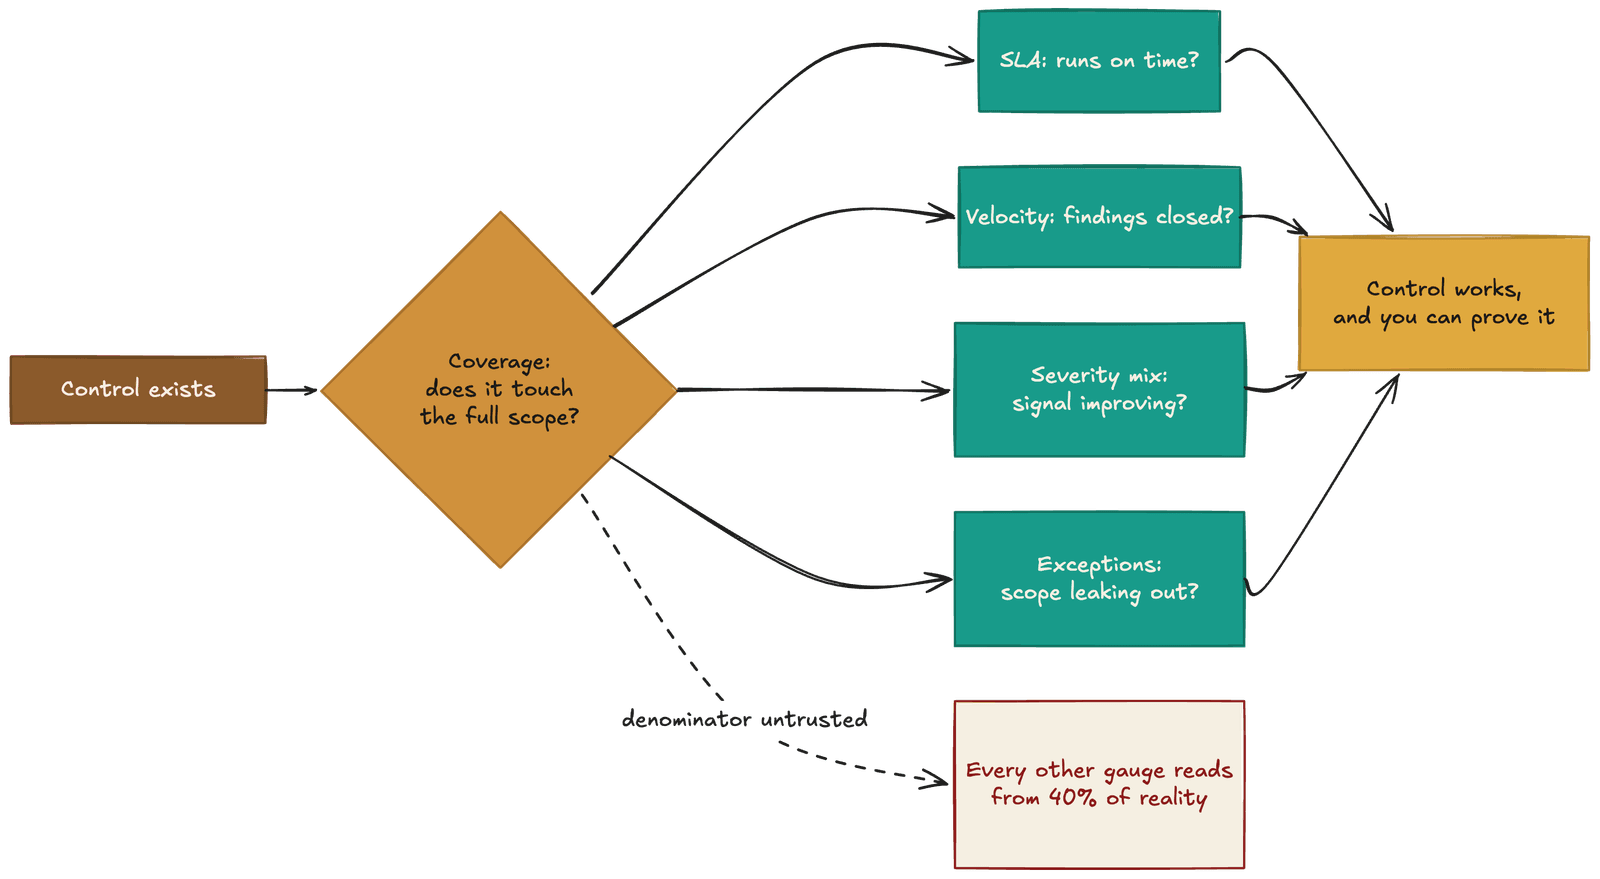
Perfect closure velocity on 40% coverage is a well-run control governing less than half the problem. Perfect coverage with an unmeasured exception rate is a fence with a gate you never audit.
1. Coverage
Of everything the control claims to govern, how much does it actually touch?
Replaces: the scoping fiction. "Control implemented" with the denominator quietly set to enrolled assets, onboarded teams, or whatever the tool can see. This is the 100%-that-means-20% Venables warns about, and it is the single most common way an existence check lies.
How to measure: governed items over all items in scope. This is Venables' own exemplar SLI, policy-evaluated flows over total flows, generalized to any control. The numerator comes from the control's own telemetry. The denominator must come from somewhere the control can't edit: your true asset inventory, which at most companies lives in infrastructure code rather than the CMDB.
Uplift to track: denominator honesty first, then the ratio. Expect coverage to drop the first time you fix the denominator. That drop is progress, and reporting it builds more trust than any green dashboard.
What it lets you decide: whether the control's assurance claim is even well-formed. Coverage is the gate metric; every other number on this sheet is meaningless until you trust this one. It answers the customer-security-review question honestly and tells you where expansion, not tuning, is the next spend.
2. Remediation velocity (MTTR)
When the control finds something, how long until it's fixed?
Replaces: the findings list. Detection controls that surface issues nobody closes, reported as "control operating" because the scanner ran. Activity, not outcome.
How to measure: median and p90 time from finding-created to finding-closed, per severity band. The tail is the metric; one 300-day finding hiding behind a pleasant average is exactly the signal a heatmap eats.
Uplift to track: p90 shrinking quarter over quarter, and the shape of the distribution tightening. A falling median with a growing tail means you got faster at easy findings and slower at the ones that matter.
What it lets you decide: where remediation capacity actually goes, and whether a detection control deserves its budget. It is also the number that converts a control conversation into an engineering conversation, because MTTR is a metric engineers already respect.
3. SLA adherence
Of the runs the control promised, how many happened on time?
Replaces: the calendar attestation. "Access reviews are performed quarterly" evidenced by the last one, while the schedule quietly slips. Adherence catches silent degradation: the control still exists, it just stopped happening when promised.
How to measure: on-time runs over promised runs, across a rolling window. Then borrow the CRE move that gives the number teeth: an error budget. Decide in advance how much lateness a tier-1 control is allowed, and define what stops when the budget is spent.
Uplift to track: budget consumption rate, not just the adherence percentage. A control burning 80% of its lateness budget by mid-quarter is telling you something the quarterly report won't.
What it lets you decide: when to intervene before the failure, and whether your risk appetite statement is real. An appetite with no error budget attached is a preference. It also flags drifting goals: a deadline that moved three times is a lowered target wearing a process improvement costume.
4. Severity distribution
What mix of findings does the control produce over time?
Replaces: the raw count. "1,847 findings processed" says nothing; the mix and its trend say almost everything. Counting findings is how programs end up optimizing noise production.
How to measure: share of findings by severity band, trended across quarters, per control. Watch two shapes: a healthy environment shifts the mix downward over time; a healthy detector still occasionally finds highs.
Uplift to track: downward drift in the mix with stable or growing coverage. The pairing matters, because a prettier severity mix on shrinking coverage is a worse program with a better chart.
What it lets you decide: whether the environment is improving or the sensor is dying. A control that has never produced a single high-severity finding is a detector reading zero, not proof of safety: to borrow Venables' radiation-detector analogy, zero means either a safe room or a broken sensor, and you cannot tell which without injecting a test. And watch the manual version of the same zero: a severity mix that improves because triage got more generous is the broken sensor, achieved by hand. This is where an annual threat-driven review of the workflow itself earns its place.
5. Exception rate
How much of the population has been excused from the control, and what happens to those exceptions?
Replaces: the waiver drawer. Exceptions approved in a hurry, filed nowhere in particular, outliving the person who signed them. Every exception is scope the control no longer covers, and unmanaged exceptions are how a control dies without a death certificate.
How to measure: excepted items over governed items, plus two qualifiers: exception age distribution and closure rate. An exception without an expiry date is an unacknowledged descoping, whatever the waiver form calls it.
Uplift to track: median exception age falling, closure rate rising, and zero exceptions without expiry. The ratio itself may legitimately stay flat; hygiene of the exception population is the improvement signal.
What it lets you decide: the control's real scope, which is what your coverage number silently depends on. It also gives you the most honest risk-acceptance register you will ever have, because aged exceptions are risk acceptances that never went through the front door.
The effectiveness sheet
This is the artifact. One row per tier-1 control, five numbers, a named owner, reviewed monthly.
Metric | Replaces | Formula | Uplift signal | Red flag |
|---|---|---|---|---|
Coverage | The scoping fiction | governed / total in scope | Honest denominator, then ratio up | Denominator = "enrolled", not "existing" |
Remediation velocity | The findings list | median + p90 time-to-close | p90 shrinking, tail tightening | Tail hidden by the average |
SLA adherence | The calendar attestation | on-time / promised runs | Error-budget burn slowing | Deadlines that quietly moved |
Severity distribution | The raw count | severity mix, trended | Mix drifts down, coverage stable | Zero highs forever, celebrated |
Exception rate | The waiver drawer | excepted / governed, with age | Exception age falling, expiries enforced | Exceptions without expiry |
What the sheet looks like as a query, because every one of these is a query on data you already have:
-- Four of the five, from the control's own event stream. You are reading, not deploying:
-- in reality this is three or four queries against three or four systems.
SELECT
  percentile_cont(0.5) WITHIN GROUP (ORDER BY close_days)         AS ttc_median,
  percentile_cont(0.9) WITHIN GROUP (ORDER BY close_days)         AS ttc_p90,   -- the tail
  COUNT(*) FILTER (WHERE close_days IS NULL AND past_sla)         AS zombies,   -- open past SLA; excluded medians lie
  COUNT(*) FILTER (WHERE promised AND on_time)::float
    / NULLIF(COUNT(*) FILTER (WHERE promised), 0)                 AS sla_adherence,
  COUNT(*) FILTER (WHERE severity = 'high')::float / NULLIF(COUNT(*), 0) AS high_sev_share,
  COUNT(*) FILTER (WHERE excepted)::float / NULLIF(COUNT(*) FILTER (WHERE governed), 0) AS exception_rate
FROM control_events
WHERE control_id = 'access-review-q';

-- Coverage is the one number this stream can never give you: items the control
-- never touched produce no rows. The denominator has to come from an inventory
-- the control can't edit. That's next week's issue.
Three rules that keep the sheet honest
The engineering world has already run this experiment at scale, and its measurement research left warnings worth importing on day one.
Every metric ships with its counterweight. DX's Core 4 framework pairs every speed metric with a quality metric, because an unpaired number gets gamed in the direction it points. Pair MTTR with reopen rate, SLA adherence with coverage, severity mix with detection volume. A number that improves alone is a number being farmed. The engineering-metrics literature has a name for the end state: evidence maxing, screenshots generated to look compliant. Goodhart's law does not spare compliance.
Team-level always, individual never. The same research is blunt about deployment: aggregate at the team level, never attribute to individuals. The moment a person is graded on MTTR, MTTR stops being information. These are control health metrics reviewed by a named control owner, not a performance review, and not a program scorecard to wave at the board.
Attach the consequence when you define the metric. A floor with nothing beneath it is decoration. Steal CRE's mechanism whole: when the error budget is spent, something stops, and everyone knew what before the breach. If your number can drop below its floor and nothing changes, you have measured your way into better-looking theatre.
One more test worth stealing, from supply-chain-security land: the ten-minute test. If your control sheet cannot tell you right now which assets a new critical CVE touches, whether the scanner covered them, and who owns the stragglers, you do not have a monitoring control. You have a reporting ritual with a dashboard.
Start this week
Pick one tier-1 control.
Fill its row: five numbers, even if two of them are "unknown." Unknown is a finding.
Set the floor for each number, pair each with its counterweight, and write down what happens when the floor breaks.
Name the owner and put a monthly 20-minute review on the calendar.
Retire one activity metric you currently report. Measure the work not done.
The obvious next question is where the denominators come from. Coverage needs a true asset inventory, exception rates need to know what "everything" is, and the most reliable answer at most companies sits in a place GRC rarely reads but I’ll share that in next week’s issue ;)
That’s all for this week’s issue, folks!