⚙️ The GRC Debugger: Finding Why a Control Failed Without a Meeting
A GRC Engineering method for control failures: find the frame that broke and step into the checks behind its pass.
When a program crashes, the engineer who wrote it does something that looks like skipping the log. They scroll to the bottom of the traceback and open the file at the line the last frame names.
Engineers run this review on themselves every day and call it debugging. GRC runs its version once a year and calls it audit readiness; when a control fails between audits, it books a meeting.
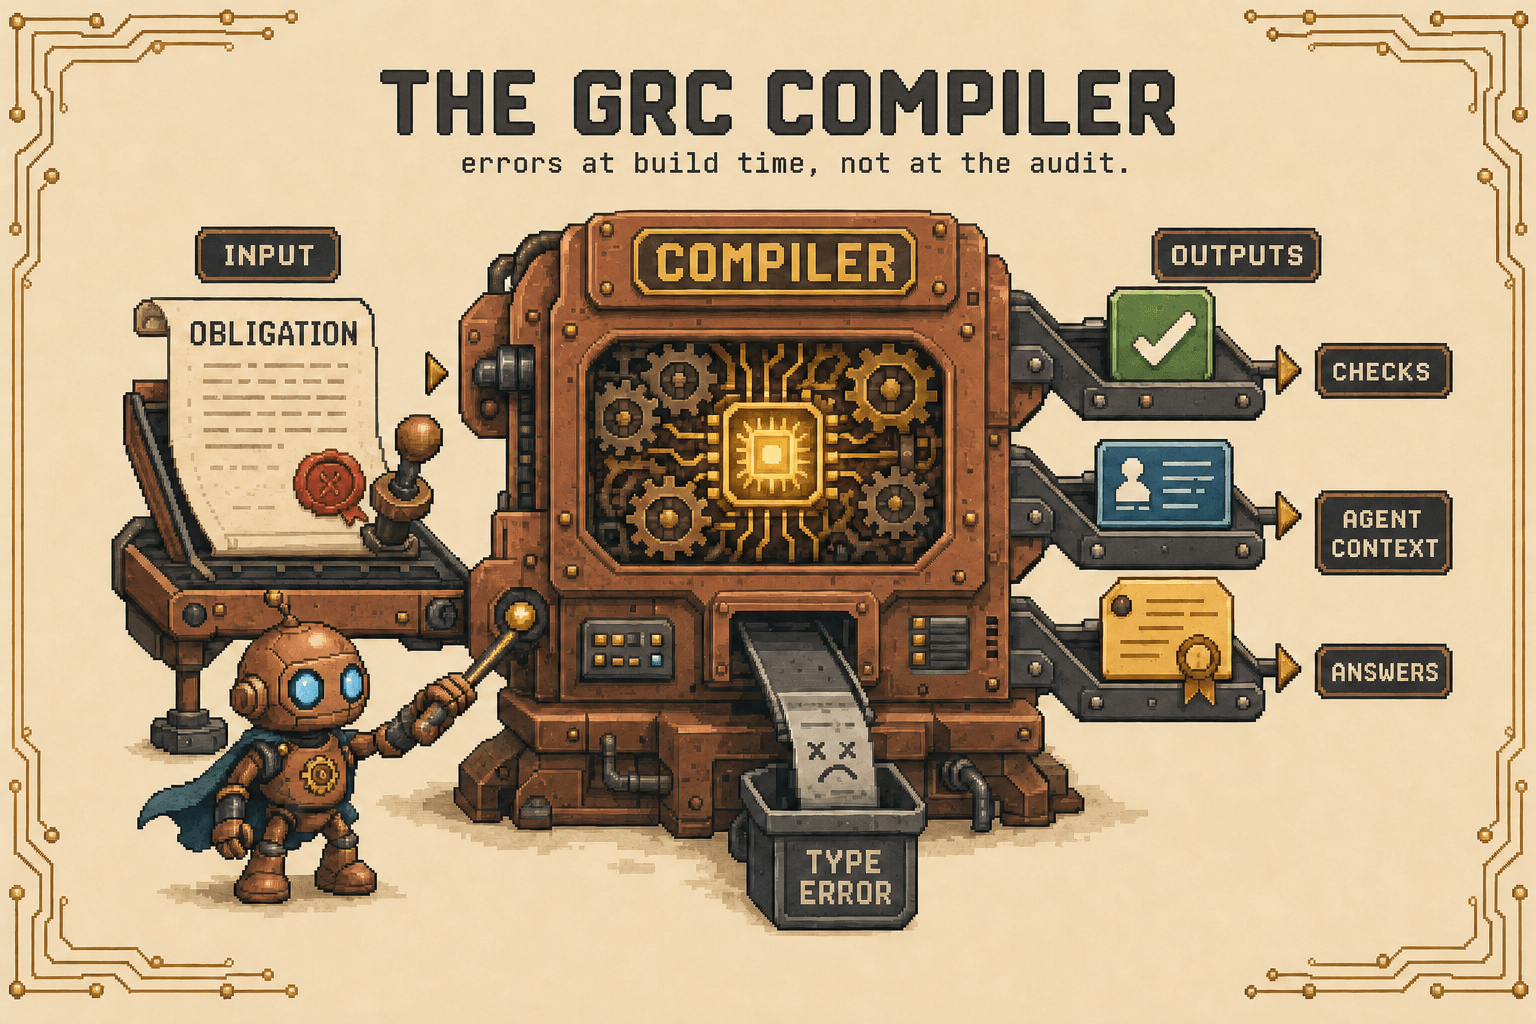
Last issue covered the compiler. This issue covers what you use when the bug reaches production.
What a stack trace is
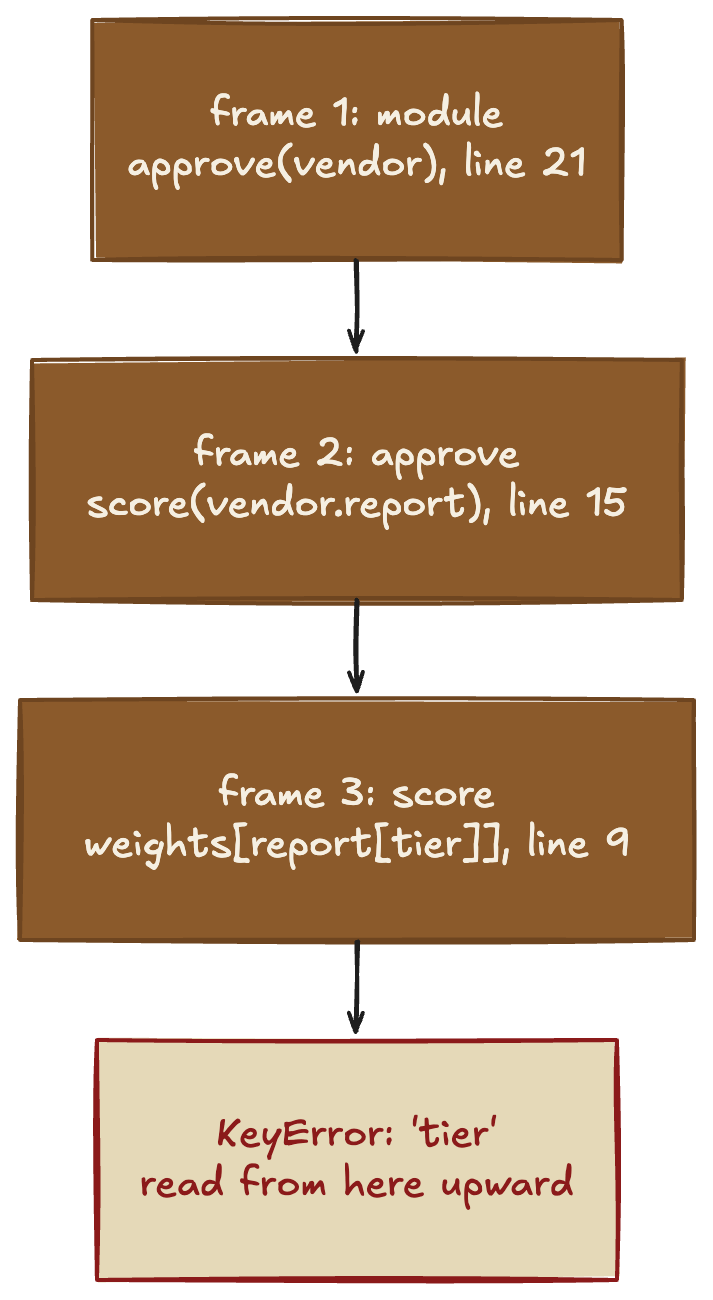
A program is a chain of calls. The script itself, which Python prints as <module>, calls approve, approve calls score, score reads a field that is missing, and the program dies inside score.
The stack trace is that chain, printed when the program stops. Each entry is a frame: one function, the file it lives in, and the line it was executing. For every frame but the last, that line is the call into the next frame; for the last frame it is the line that raised.
Traceback (most recent call last):
  File "review.py", line 21, in <module>
    approve(vendor)
  File "review.py", line 15, in approve
    return score(vendor.report) < threshold
  File "review.py", line 9, in score
    return weights[report["tier"]]
KeyError: 'tier'
Engineers read this from the bottom. The last line is the error itself: a dictionary had no key called tier. The frame above it is where that happened, line 9 in score.
The Python tutorial describes that part of the message as the context where the exception occurred, in the form of a stack traceback. (An uncaught exception is a failure the program noticed and refused to continue past; the traceback is its receipt.)
Stopping the program before it dies
The trace arrives after the crash. A core dump can arrive with it: the program's memory saved at that moment, which you can load into a debugger later.
A breakpoint is a marker on one line of code. When execution reaches that line, the program freezes, and you can inspect every variable as it is at that moment. The debugger lists them in a locals pane, one set per frame. A conditional breakpoint only pauses when a test you wrote is true.
Chrome's DevTools guide calls this pausing your code, and it includes two checkboxes that pause on uncaught and on caught exceptions. (DevTools is the debugger built into the Chrome browser; every browser ships one.)
This is what a paused program looks like, in Python's built-in debugger:
> /app/approvals.py(42)approve_change()
-> if change.risk_score < threshold:
(Pdb) p change.risk_score
7.4
(Pdb) p threshold
5.0
(Pdb) w
  /app/main.py(18)<module>()
-> run(queue)
  /app/main.py(11)run()
-> approve_change(change)
> /app/approvals.py(42)approve_change()
-> if change.risk_score < threshold:
(Pdb) n
> /app/approvals.py(44)approve_change()
-> return reject(change, reason="risk above threshold")
The transcript shows the paused line, two variables, the two callers above it, and one step: 7.4 is not below 5.0, so the next line to run is the reject on line 44.
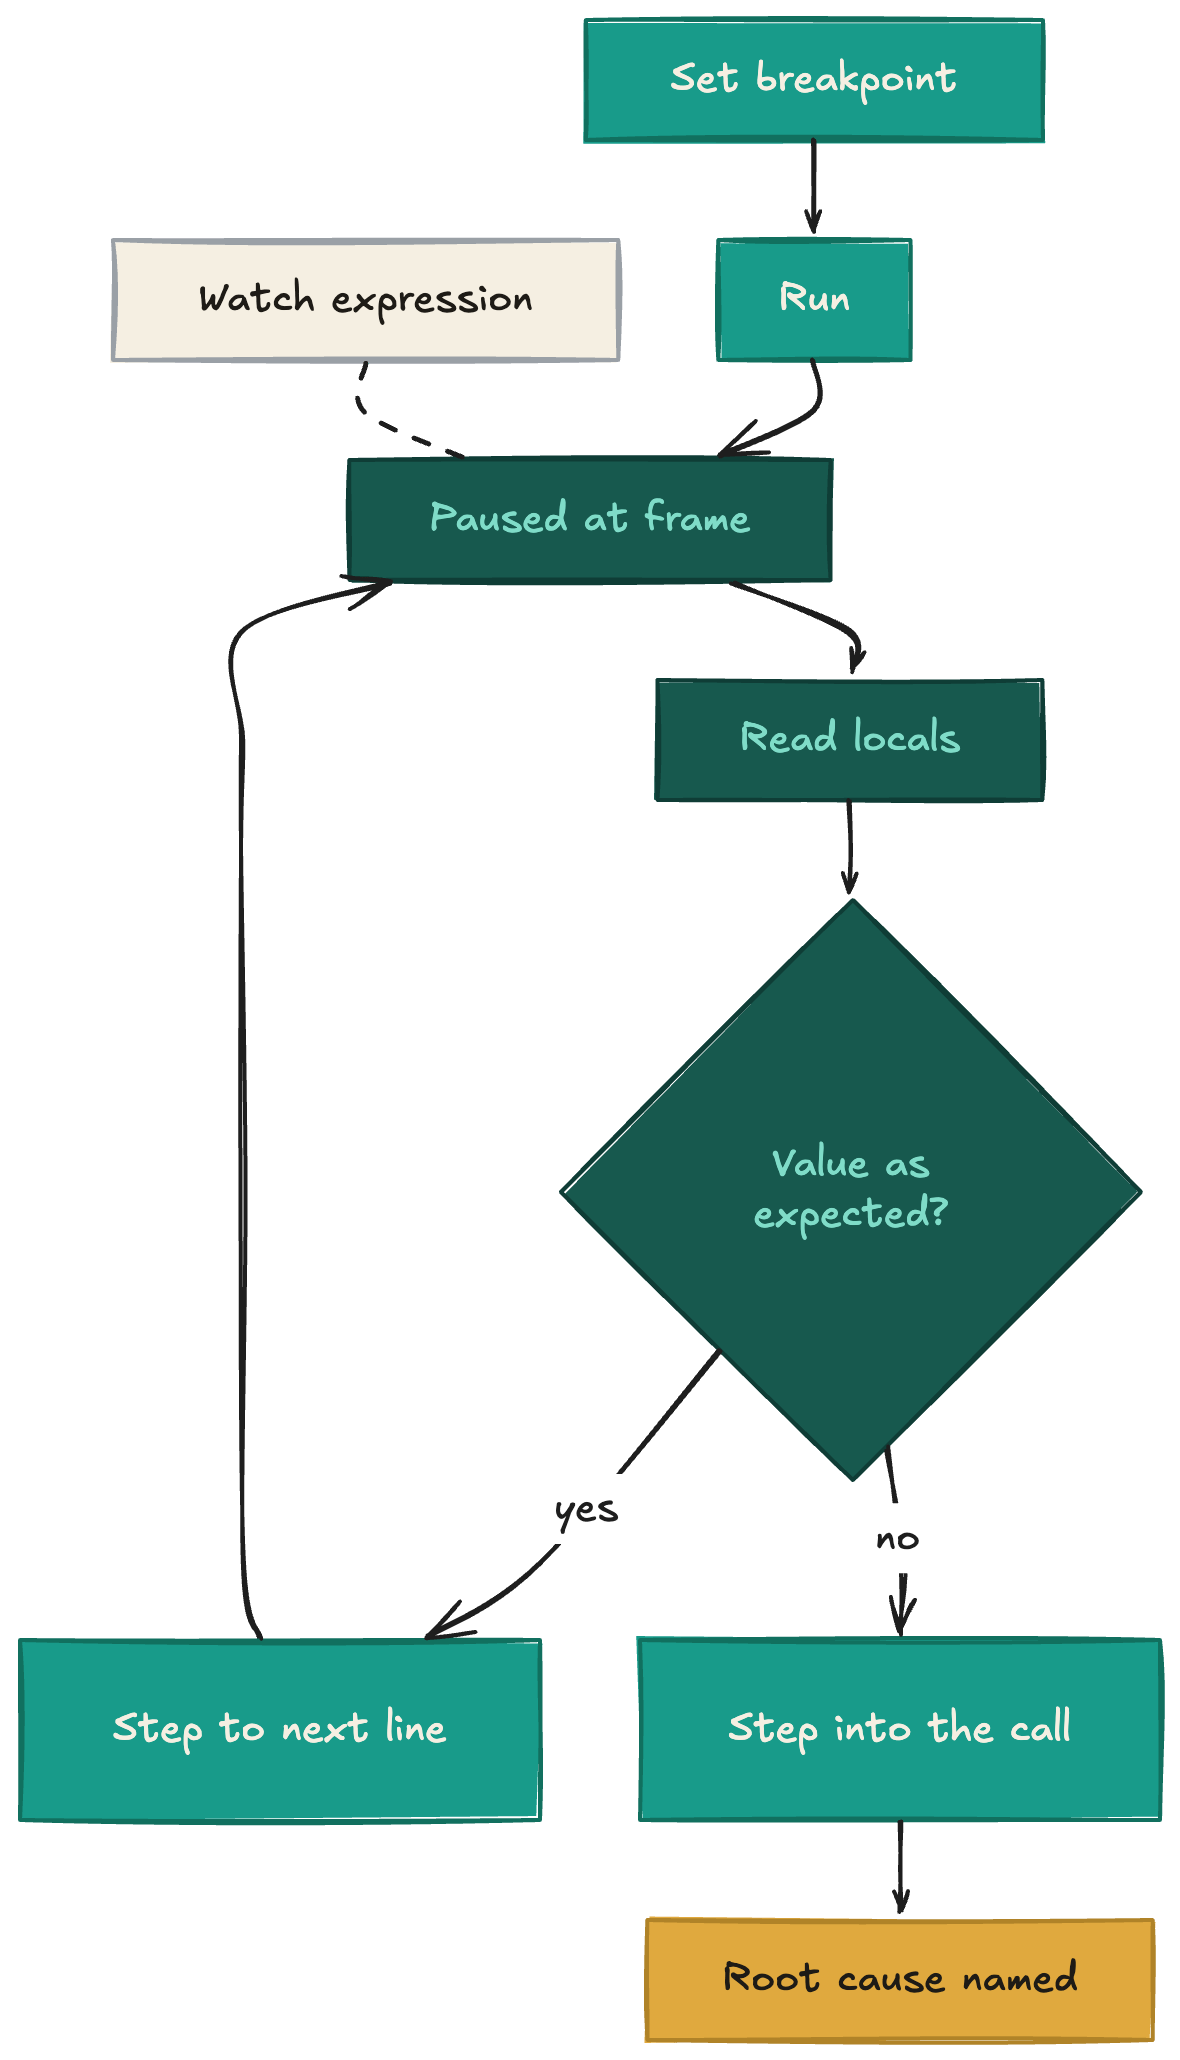
A watch expression is a value you pin to the screen while the program runs. GDB, the GNU debugger from 1986, goes further with a watchpoint: it stops execution whenever the value of an expression changes, without you predicting where that will happen.
Once paused, you move one line at a time. Step over runs the current line as a unit and stops at the next one. Step into follows the call on the current line down into the function it calls, so you can keep stepping inside it until the value changes.
The root-cause meeting
The crash, in GRC: during an incident, the restore of the billing database fails.
The finding arrives as a symptom. "Restore of a tier-1 system failed; control BKP-01 reported pass for eight consecutive quarters." That is the last line of the traceback, with nothing above it.
So a meeting gets booked. Six people in the room: two from the platform team, the incident lead, the backup vendor's account manager on a call, the internal auditor, and the person who owns the control on paper. One slide is up. It shows the last quarterly test for the billing database, dated eleven weeks earlier: status completed, duration forty minutes, a green tick.
The platform team says backups run nightly and the last test passed, and the vendor says the snapshots are healthy. The auditor asks when a restore last brought the application up with a user logged in and a real order on screen. The only date anyone has is the one on the slide.
Forty minutes later the action item reads: review the restore process.
The GRC version
As I put it in July, "a control is a process with a failure rate, not a fact."
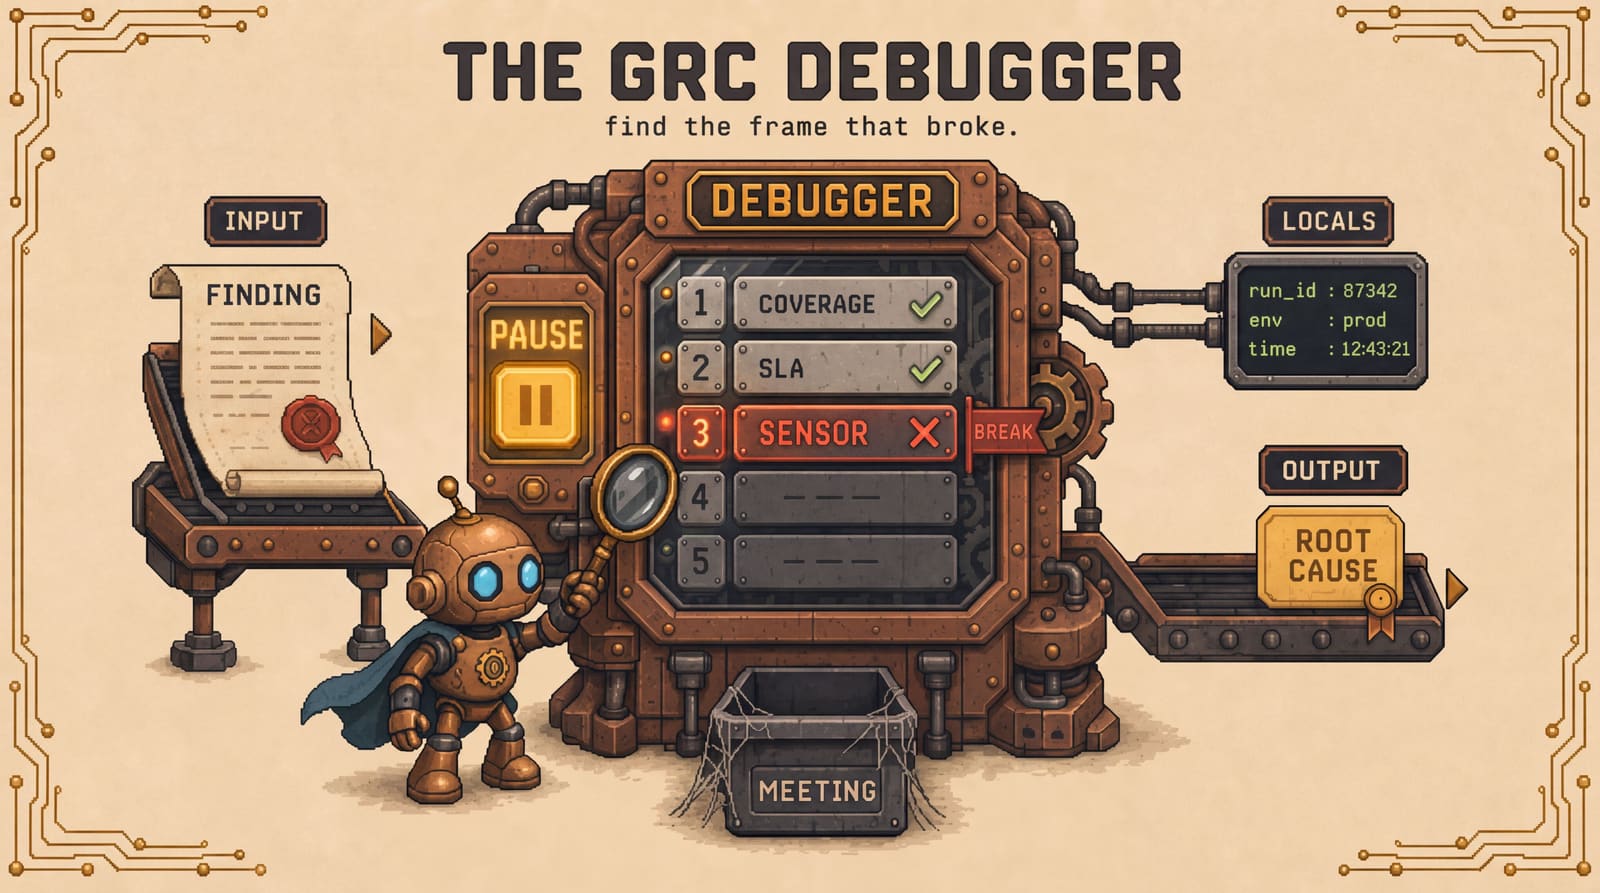
The five metrics from that issue are those frames, reordered from July's list so they step from whether the control ran to whether it was excused:
Did the control touch the whole population (coverage)?
Did it run when promised (SLA adherence)?
Did it find what it should (severity distribution, read as sensor health)?
Was what it found fixed (remediation velocity)?
Was the item excused instead (exception rate)?
The locals of each frame are the metric's value and its floor, plus the field that says where the number came from. Read across all five frames, they are the effectiveness sheet row, "five numbers, a named owner, reviewed monthly" as July's issue put it.
# bkp-restore.trace.yaml: one failing control, five frames
control: "BKP-01:quarterlyrestoretestforeverytier-1system"
owner: platform-team
population: "tier-1systems,24"
history: "8quarters,192testruns,192markedpass"
finding: "billingdatabaserestorefailedduringanincident;itslast8quarterlytestsaremarkedpass"
frames:
  - coverage:              {value: 1.00, floor: 0.95, denominator: tier1_system_inventory, source: cmdb}
  - sla_adherence:         {value: 1.00, floor: 0.95, promised_runs_last_year: 96, on_time_runs: 96, source: scheduler_log}
  # below the floor means the sensor is dead
  - severity_distribution: {findings_last_8_quarters: 0, floor_findings_per_year: 1, trend: flat, sensor: restore_job_status}
  - remediation_velocity:  {value: unknown, reason: no findings to fix, floor: n/a, source: finding_tracker}
  # exception rate passes by staying under its floor
  - exception_rate:        {value: 0.08, floor: 0.10, excepted: 2, scope: restore_time_target, still_tested: true, oldest_days: 410, without_expiry: 2, source: exception_register}
error: "severity_distribution0findingsin8quarters,floor1peryear,inframe3:thetestcannotseeabadrestore"
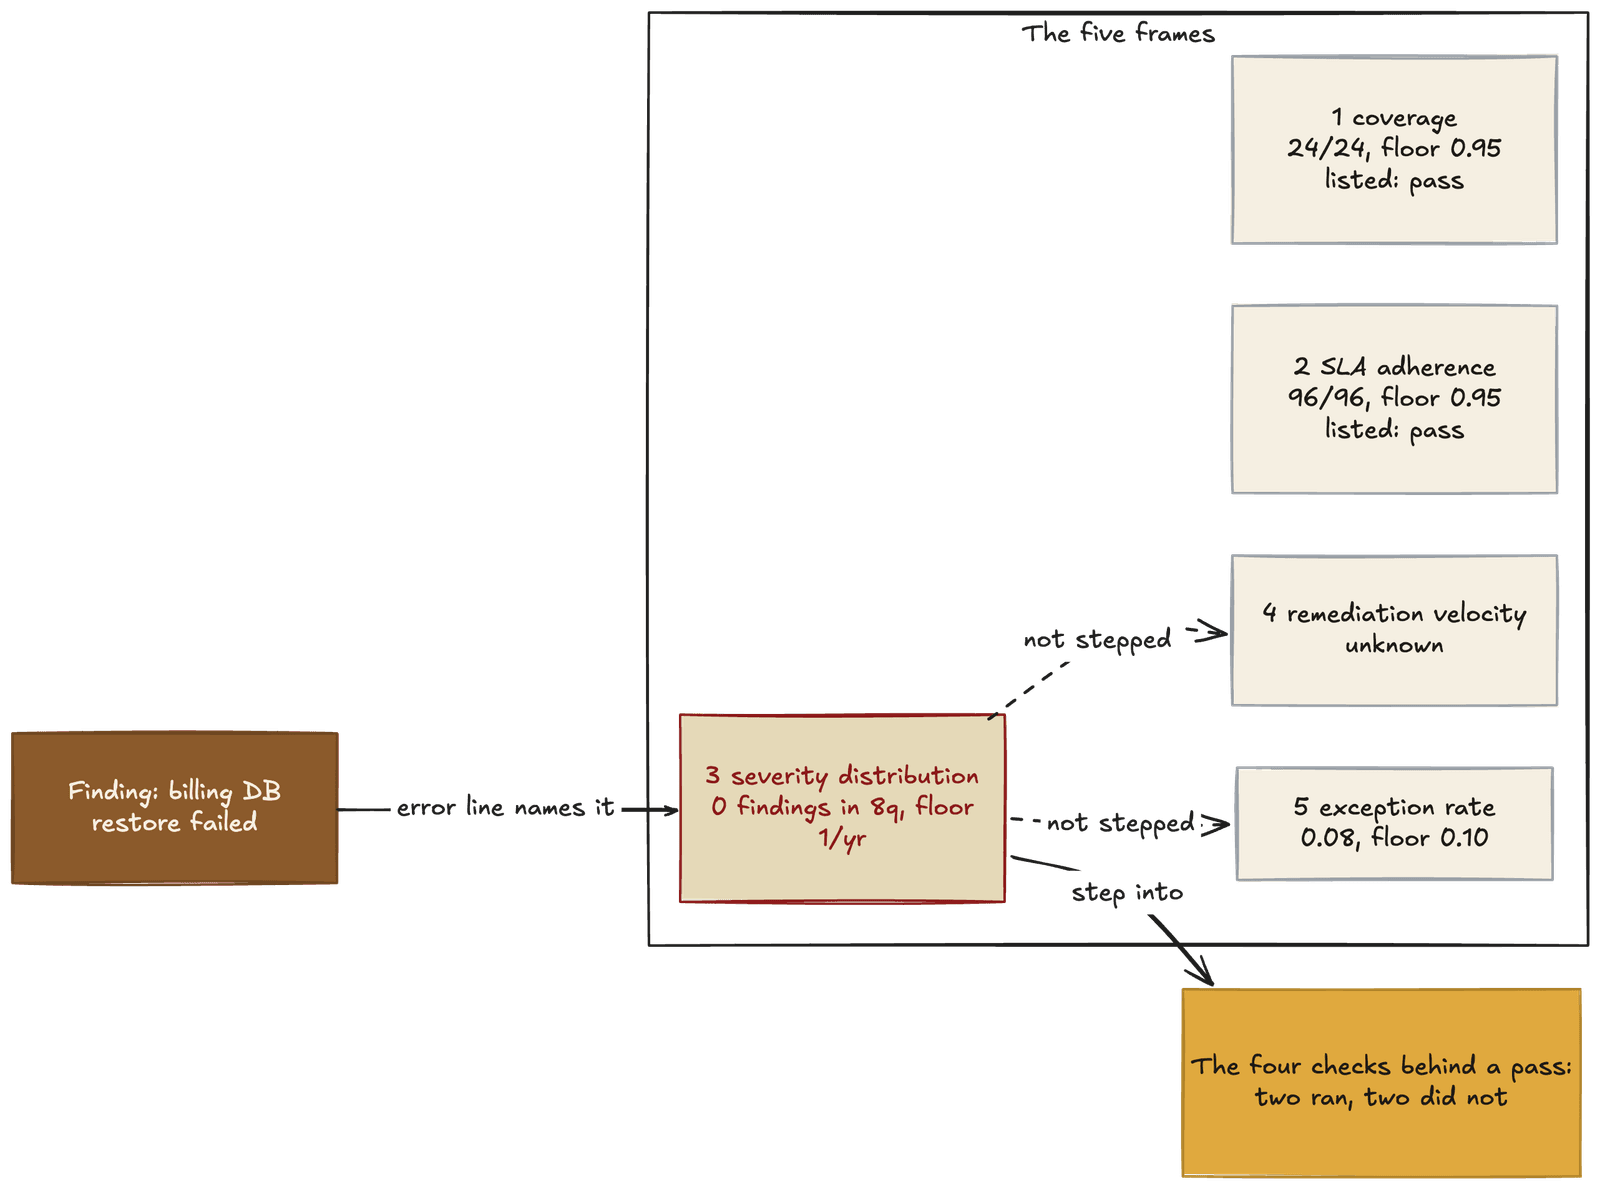
Read it from the bottom. The error line names the frame that broke, and frame 3 sits two frames above the last one.
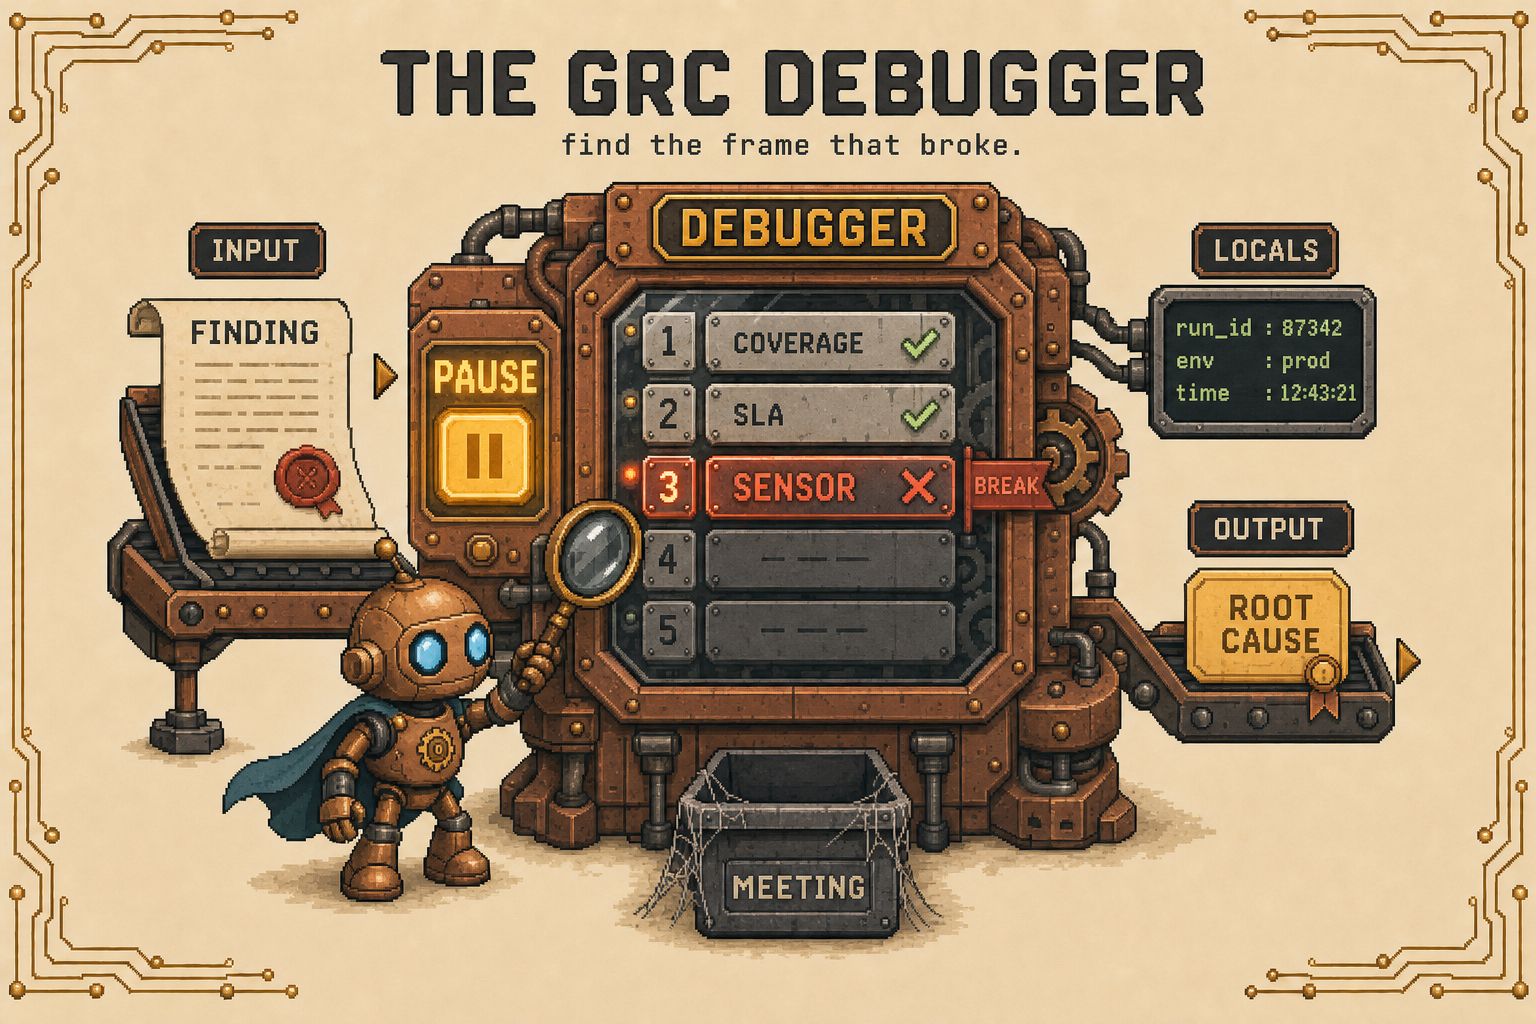
The session pauses on frame 3: you set the breakpoint on it by name, which is what the paused line shows. Frames 1 and 2 are listed as passes, coverage 1.00 and every promised run on time, and the session did not step them. Frame 3 is zero findings for eight quarters. A detector that works finds something now and then, so the debugger stops here.
The same session, for the control:
# what a control debugger session would print; no such tool ships today
> BKP-01 frame 3 severity_distribution
-> findings_last_8_quarters 0  floor_findings_per_year 1
(grc) p locals()
sensor=restore_job_status  runs=192  findings=0  trend=flat
(grc) w
  frame 1 coverage               24/24    floor 0.95   pass
  frame 2 sla_adherence          96/96    floor 0.95   pass
> frame 3 severity_distribution  0 in 8q  floor 1/yr   BREAK
  frame 4 remediation_velocity   unknown               not stepped
  frame 5 exception_rate         0.08     floor 0.10   not stepped
(grc) step-into checks
restore_job_status == completed   checked
bytes_restored > 0                checked
application_boot                  not checked
row_count == source               not checked
Step into frame 3 and the four checks a pass should rest on are on screen; two of them ran. The sensor checks job status and byte count. A restore that writes a full-size file of unreadable pages passes both.
When there is no error line yet, you step from frame 1 and stop at the first number that is blank or out of bounds. That is the monthly review.
A blank metric is the finding, and the frames below it are not stepped. Frame 4 is blank because frame 3 never produced anything to fix; frame 5 has a number, 0.08, and the debugger has not reached it.
The listing also shows frame 5: two systems carry a waiver on the restore-time target, both without an expiry, and both are still tested. Frame 5 would pass at 0.08 for as long as those waivers stand.
Set a conditional breakpoint on frame 3: zero findings for four consecutive quarters pauses the review. The check fires at the fourth quarterly zero, at least a year before the incident. The auditor's sample would have drawn from the same 96 passes that year.
Set a watchpoint on coverage and the review stops the day a new system enters the tier-1 inventory without a test schedule: 1.00 becomes 0.96.
💡 A debugger is a root-cause meeting where the state is still there.
Debugger concept | GRC equivalent |
|---|---|
Stack trace | The five metrics, in order |
Paused session | One frame, its numbers on screen |
Locals pane | One frame's value, floor and source |
Step-into | The procedure behind a pass, check by check |
Core dump | The audit evidence folder: numbers at one date, no debugger to load them |
The debugger needs the effectiveness sheet as rows, one per tier-1 control, in the central data layer I argued for; each frame is then a query run against one failing control. That is the GRCX direction from two issues ago, and it remains a candidate practice until a pilot prints a trace for a real finding.
Try this week
Pick the metric with no number and write down who owns the query that would fill it.
Set one breakpoint: pick the metric that has never failed and ask what its test checks.
That’s all for this week’s issue, folks!